fitcircle
| 官方文件: | fitcircle |
|---|---|
| 簡介: | 擬合球面上數據點的平均位置及圓弧 |
該命令從輸入數據的前兩列讀取經緯度數據,將其轉換爲單位球面上的笛卡爾三維矢量,然後計算輸入座標數據的平均位置以及可以擬合這些座標點的大圓路徑的pole。
必選選項
<table>- 輸入數據
-L<norm>
-L1解法1-L2解法2-L或-L3同時輸出解法1和解法2的結果在計算輸入座標的均值和大圓弧pole時有兩種計算方法,分別用
-L1和-L2表示。當數據沿着某個大圓弧且距離接近時,兩組解結果相似。若數據較分散,則大圓弧的pole要比均值不精確得多。此時可以比較兩組結果以作爲相互的驗證。The -L1 solution is so called because it approximates the minimization of the sum of absolute values of cosines of angular distances. This solution finds the mean position as the Fisher average of the data, and the pole position as the Fisher average of the cross-products between the mean and the data. Averaging cross-products gives weight to points in proportion to their distance from the mean, analogous to the “leverage” of distant points in linear regression in the plane.
The -L2 solution is so called because it approximates the minimization of the sum of squares of cosines of angular distances. It creates a 3 by 3 matrix of sums of squares of components of the data vectors. The eigenvectors of this matrix give the mean and pole locations. This method may be more subject to roundoff errors when there are thousands of data. The pole is given by the eigenvector corresponding to the smallest eigenvalue; it is the least-well represented factor in the data and is not easily estimated by either method.
選項
-Ff|m|n|s|c控制輸出格式。
正常情況下,該命令會將計算結果以較複雜的形式輸出。使用
-F選項,則只返回簡單的座標。-F後可以加上其他修飾符以指定要返回的座標:fFlat Earth mean locationmmean locationnnorth pole of great circlessouth pole of great circlecpole of small circle and its colatitude, which requires-S
-S[<lat>]擬合小圓弧而不是大圓弧
The pole will be constrained to lie on the great circle connecting the pole of the best-fit great circle and the mean location of the data. Optionally append the desired fixed latitude of the small circle [Default will determine the latitude].
示例
如下命令,用兩種計算方法擬合了數據的大圓弧路徑和小圓弧路徑,並藉助 project 生成路徑座標。
#!/bin/bash
# test/fitcircle/circles.sh
#
# Tests gmt fitcircle on spherical data points

ps=fitcircle_ex1.ps

# Fit great circle to red points and small circle to green points
# Plot the best-fitting great and small circles as well as the
# location of the mean locations and pole locations for both
# the -L1 and -L2 options (i.e., -L3).

gmt fitcircle gcircle.txt -L3 > g.txt
gmt fitcircle scircle.txt -L3 -S > s.txt
gpole1=`grep "L1 N Hemisphere" g.txt | gawk '{printf "%s/%s\n", $1, $2}'`
gpole2=`grep "L2 N Hemisphere" g.txt | gawk '{printf "%s/%s\n", $1, $2}'`
spole1=`grep "L1 Small Circle Pole" s.txt | gawk '{printf "%s/%s\n", $1, $2}'`
spole2=`grep "L2 Small Circle Pole" s.txt | gawk '{printf "%s/%s\n", $1, $2}'`
slat1=`grep "L1 Small Circle" s.txt | gawk '{print 90-$NF}'`
slat2=`grep "L2 Small Circle" s.txt | gawk '{print 90-$NF}'`
gmt psxy -Rg -JG-30/40/7i -P -Bg -K gcircle.txt -Sc0.04i -Gred -Xc -Yc > $ps
gmt psxy -R -J -O -K scircle.txt -Sc0.04i -Ggreen >> $ps
gmt project -G1 -T$gpole1 -L-180/180 | gmt psxy -R -J -O -K -W3p >> $ps
gmt project -G1 -T$gpole2 -L-180/180 | gmt psxy -R -J -O -K -W1p,- >> $ps
gmt project -G1/$slat1 -T$spole1 -L-180/180 | gmt psxy -R -J -O -K -W3p >> $ps
gmt project -G1/$slat2 -T$spole2 -L-180/180 | gmt psxy -R -J -O -K -W1p,- >> $ps
grep "Great Circle Pole" g.txt | gmt psxy -R -J -O -K -Sa0.2i -Gred -W0.25p >> $ps
grep "Small Circle Pole" s.txt | gmt psxy -R -J -O -K -Sa0.2i -Ggreen -W0.25p >> $ps
grep "L1 Average" g.txt | gmt psxy -R -J -O -K -Sa0.2i -Gyellow -W0.25p >> $ps
grep "L2 Average" g.txt | gmt psxy -R -J -O -K -Sa0.2i -Gyellow -W0.25p >> $ps
grep "L1 Average" s.txt | gmt psxy -R -J -O -K -Sa0.2i -Gyellow -W0.25p >> $ps
grep "L2 Average" s.txt | gmt psxy -R -J -O -K -Sa0.2i -Gyellow -W0.25p >> $ps
gmt psxy -R -J -O -T >> $ps
rm g.txt s.txt gmt.*
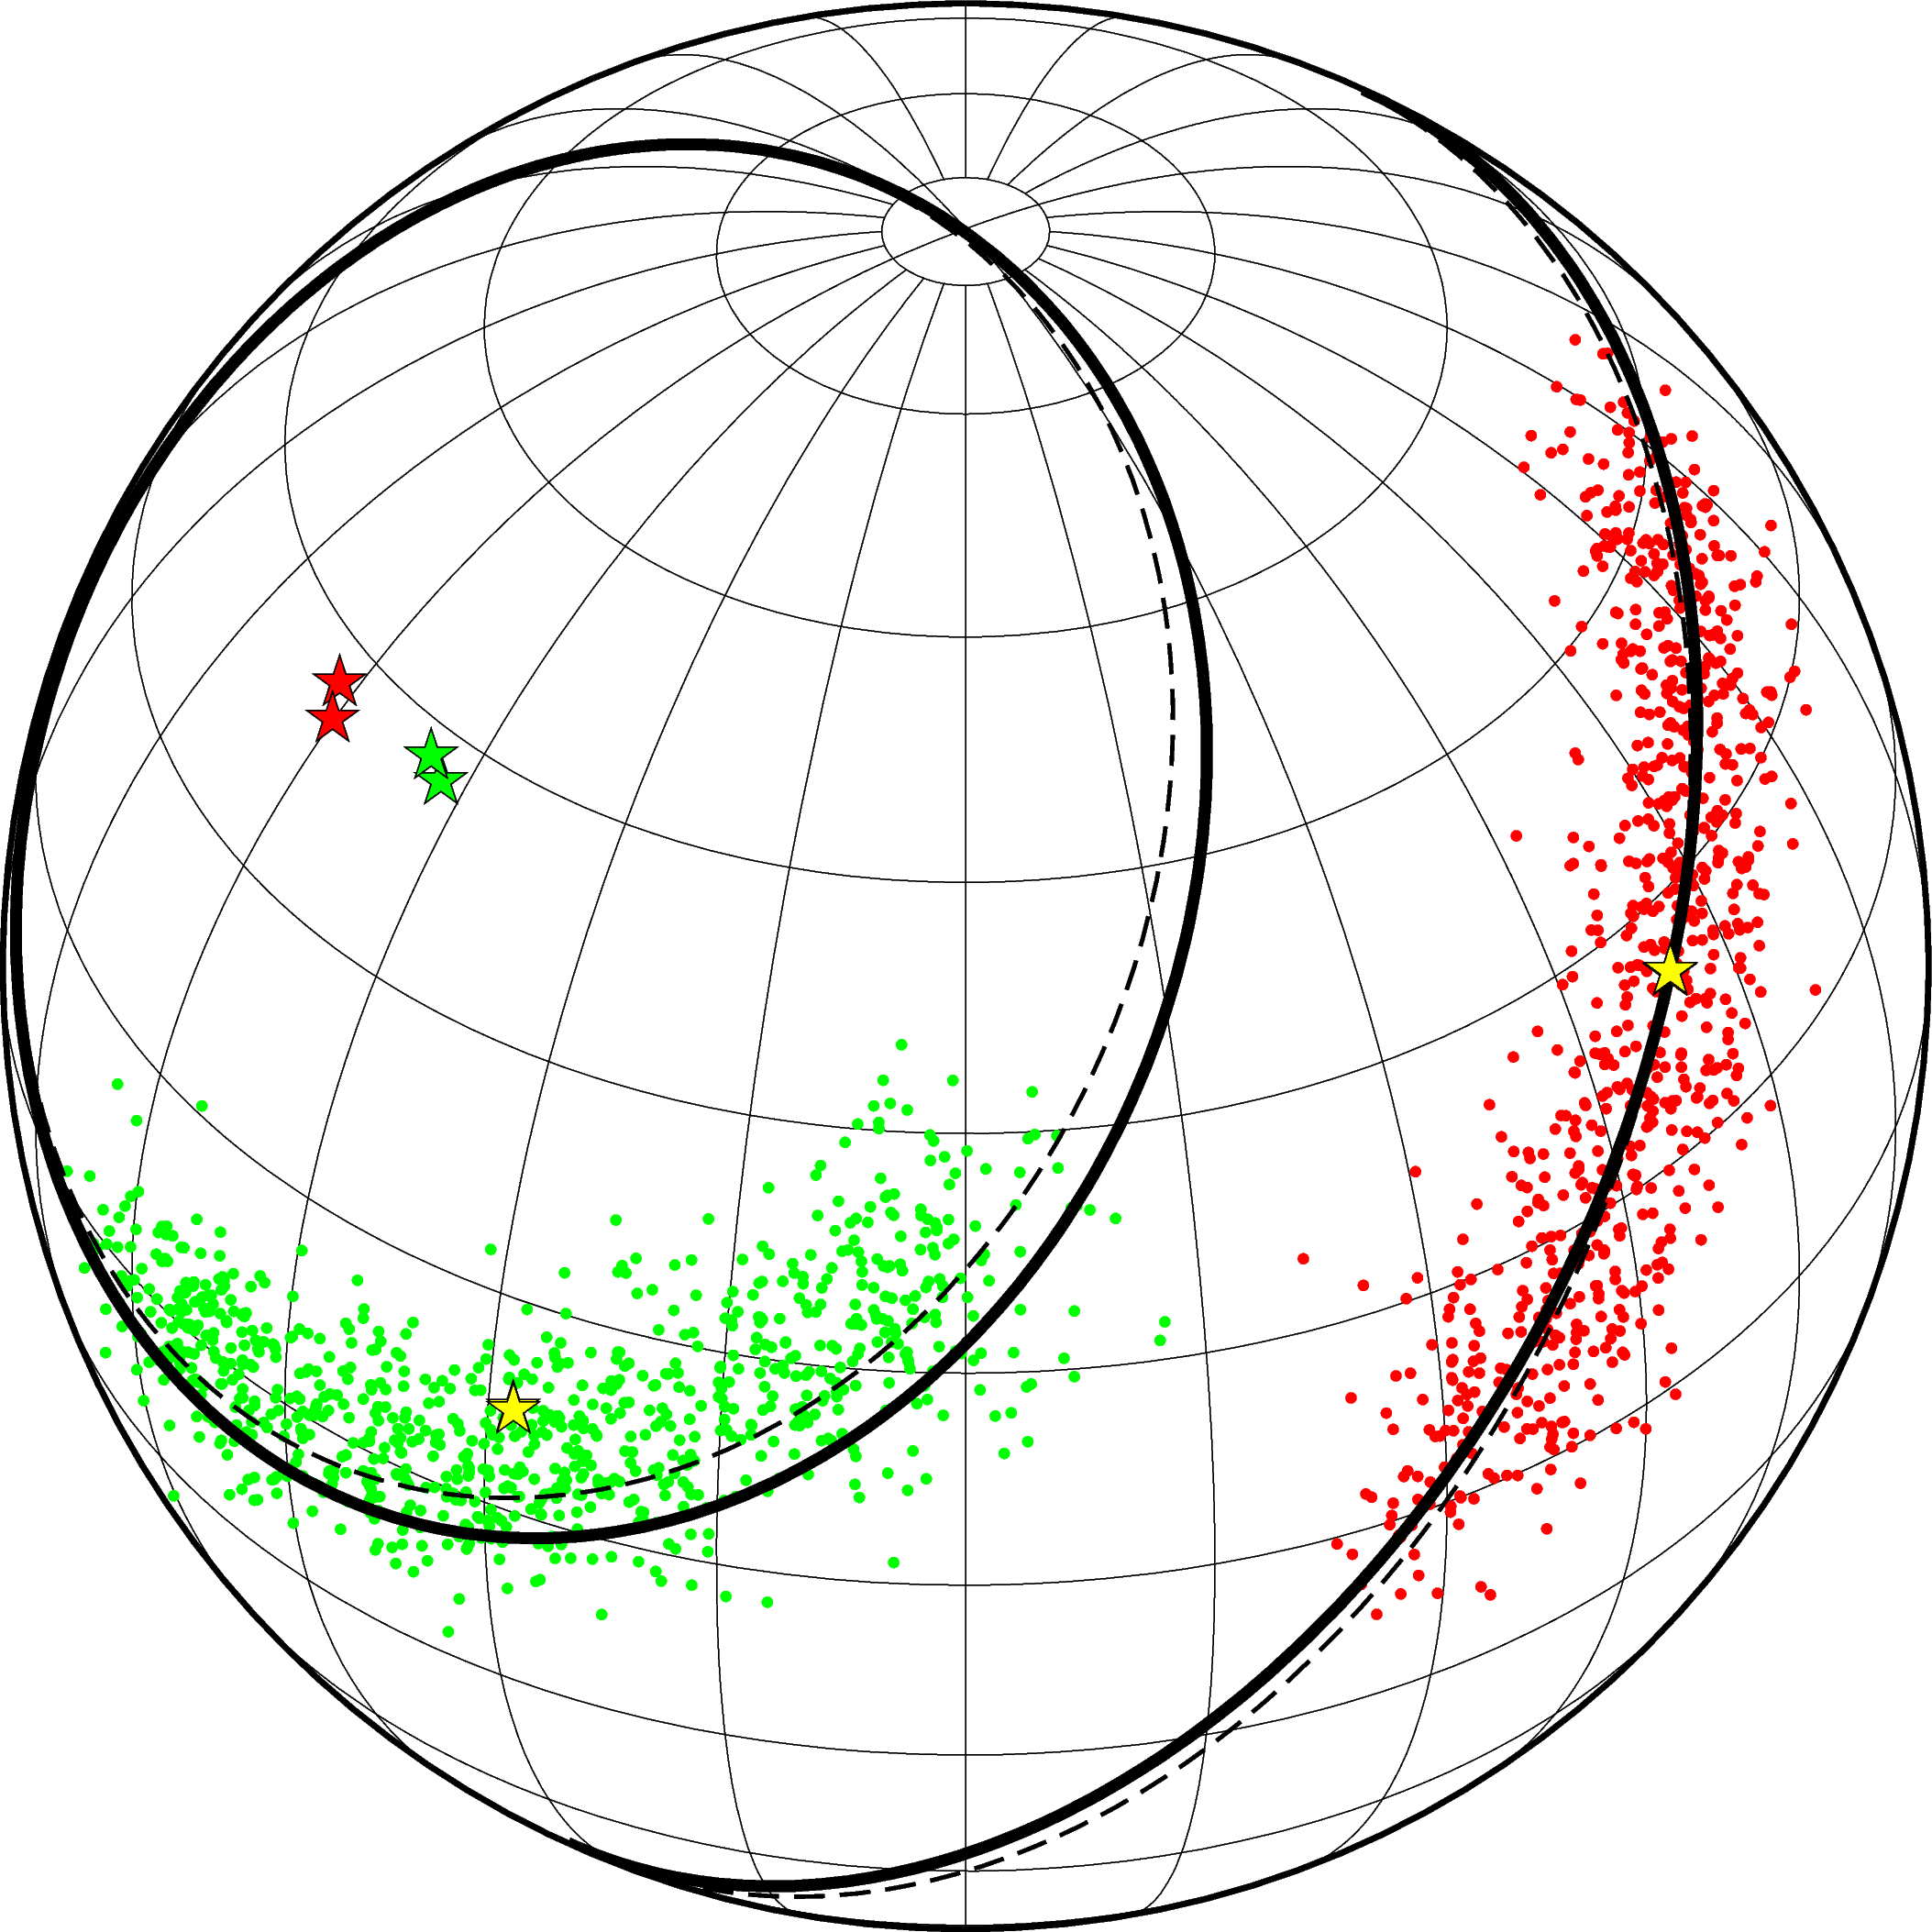
fitcircle示例